|
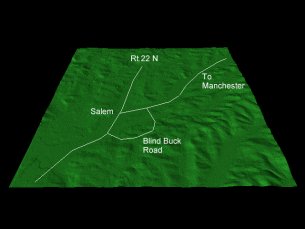
The problem with DEM data is that it does not contain anything other than elevation information. While useful for general visualization purposes, it can be difficult to locate objects precisely on the terrain model by referencing topographic features (since these can all seem to look alike). One way to improve a DEM is to overlay raster data on top. The first example shown at right adds some features by simply drawing them onto the terrain model using a graphics application. Not very satisfactory.
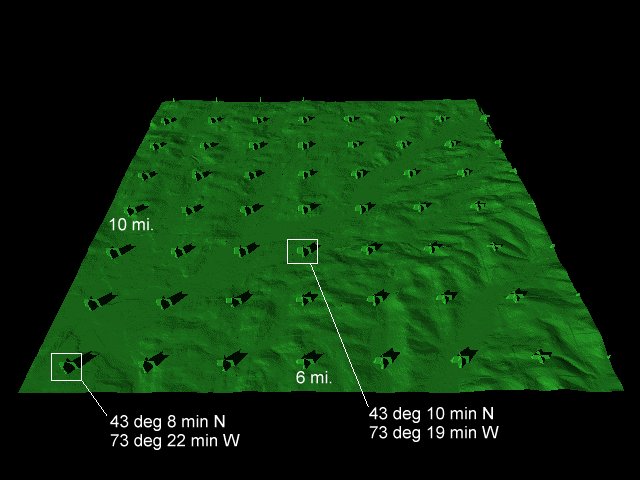
A better solution would be to overlay information over the terrain model. One way to get your bearings is to overlay a grid of Universal Transverse Mercator (UTM) ticks over the terrain model. I did this using a program called MicroDEM to overlay UTM ticks in red on a grayscale .TGA file. When rendered as a POV-RAY height field object, the red ticks became terrain features with elevations corresponding to the red color I chose. Objects can now be located precisely on the terrain model by reference to the grid for this map. This example is shown in the second image.
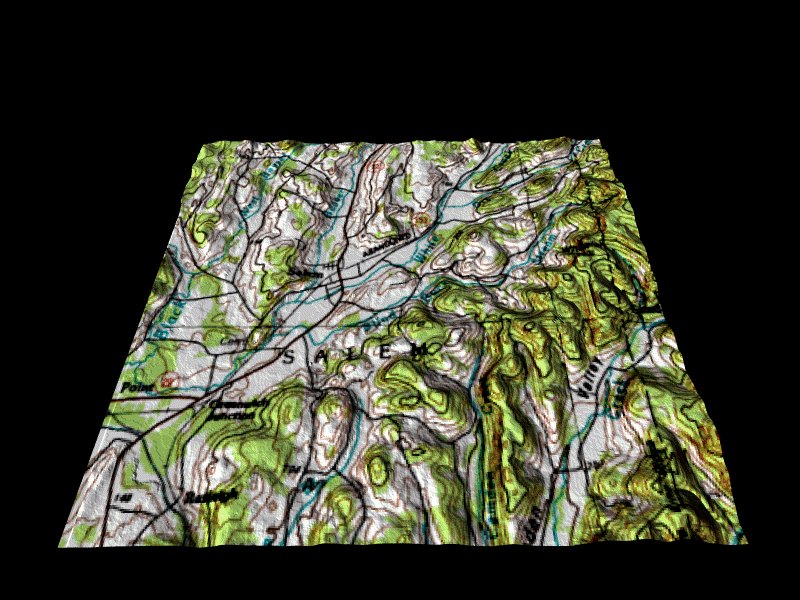
An even better technique is to overlay a USGS topographical map over the terrain model. The map shown to the right was prepared in POV-Ray using the raster-draping utility provided in that package. The overlay was screen-captured from TopoZone. Doing it this way is a laborious process involving much aligning and cropping using image processing software such as Paint Shop Pro.
There are a few tricks to getting the proper alignment. For example, it is possible to place small datum tics on the .TGA image. These can be matched to the latitude and longitude grid on the topo image to "anchor" it. The results of the overlay are shown in the third image at right.
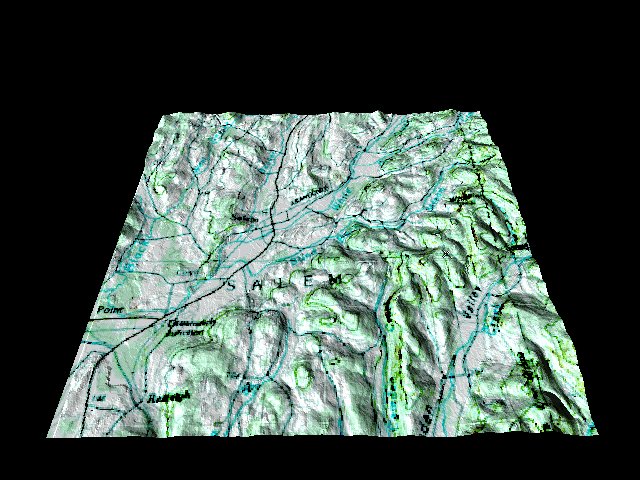
Another problem with this technique is that now the map looks a little busy. It is unnecessary and confusing to have elevation contours on a 3D terrain model. The elevation contours can actually be un-layered from the data that is desired, such as roads, political boundaries, land use data, etc. by a technique outlined in a subsequent section. However, there are easier ways. In the present example, I tried to tone down the overly by doing some image processing on the topo bitmap prior to the overlay. This processing can force the contours into the background while retaining most of the desirable information. This example is also shown at the right.
Well, this has been a lot of work. The images are OK, but not as good as we would like. Fortunately, there are other options. Stay tuned to coming sections.
|