|
Many in the cartographic field know that the former Soviet Union mapped a large part of the earth's surface, producing some of the highest quality topographic maps produced anywhere. These maps cover not only Russian empire, but most of the globe including even the United States.
Until relatively recently, these maps were secret and unavailable. But with the collapse of the Soviet Union in the early 1990s, these maps became available commercially in the following scales:
1:1,000,000
1:500,000
1:200,000
1:100,000
1:50,000
1:25,000
Companies such as Eastview Cartographic and Omnimap purchased large collections of these maps and offered them for sale individually. As discussed in an earlier article, they also specialize in the creation of DEMs from these maps by digitization of contour lines and contour line interpolation. Unfortunately, these maps are not cheap. A recent check of the Omnimap website indicated prices of $40 USD to $75 USD per map for Russian topos. Until recently, I had not been able to find any free sources that would be of value to amateur cartographers.
However, during my recent BLACKART contour line interpolation project I discovered a source for such maps. The coverage is not universal and the quality is not very high. However, hundreds of maps are available for areas where formally topographic maps of any type would have been very difficult if not impossible for most people to find. The site is the UC Berkeley Map Library. This impressive website offers topographic coverage consisting of the aforementioned Russian topos, United States Army Map Service AMS topos, as well as maps produced by British, French and other National mapping services.
Unfortunately, many of the maps are not available on line. In addition, my first attempts to produce contour line separations from a few samples have not been successful. The problem seems to be both the conditions under which the maps were scanned and the raster image resolution. Unlike digitized USGS topos scanned using essentially a four bit color model that often isolates the contour line to only one color, the Berkeley topos were scanned using a 24 bit color model. This produces up to sixteen million possible colors. Although all sixteen million will not be present on one scan, it is not uncommon for a map to use over 100,000 colors. While the contour lines may appear to consist of one or perhaps two colors, close examination indicates that hundreds of different colors can be found in the contour lines. This makes the separation task a challenge, to put it mildly.
This can be partially addressed by decreasing the color depth of the image. Although this can narrow the range of possible pixel values, it also causes "contamination" of the image as now unwanted artifacts may have many of the same pixel values as the contour lines as pixel values are approximated by the condensation algorithm. As this occurs, the intelligence resident in the artifacts that allow bandpass filtration is lost.
Another problem is the resolution. The Negev map for example is 2200 by 1700 pixels. This may seem like a large image, but a similar USGS raster topo map may be 50MB large. This large size file, while cumbersome to download and expensive to archive is the kind of resolution necessary for serious graphics and cartographic applications.
As a result, the ability to use the maps for the generation of DEMs will require more thought and image processing algorithms before they become a useful addition to the worldwide DEM database. The scanning of paper maps must remain the best strategy for this purpose for the moment (except for US topos, for which contour line separation is unnecessary anyway.) However, the Berkeley Library collection will be useful for many other purposes, and represents a welcome contribution toward the goal of universally accessible global digital elevation information.
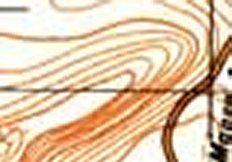
The images to the right are chips cropped from Berkeley offerings. The first map is from the extensive collection of 1:100,000 (20m contour interval) Ukrainian maps. The second is taken from a 1:50,000 (10m interval) Russian map of the Negev region in Is real. The detail is a zoomed section from this image illustrating the contour line composition that is typical of such scanned images.
|
![[Click to enlarge]](http://www.terrainmap.com/K-38-034_sm.jpg)
1:100,000 map of the Ukraine.
![[Click to enlarge]](http://www.terrainmap.com/08-36-058-2_sm.jpg)
1:50,000 map of Negev region in Isreal.

Chip showing many pixel values in contour lines.
|

