|
You cannot get too far in the mapping world without an understanding of the
coordinate systems used to specify location on the earth's surface.
Let's take a look at how to specify location on the map's x-y plane.
Of course, there is no such thing as an x-y plane when it comes to describing
the earth's surface. The earth is an ellipsoid (sort of), which is the volume you get when
you revolve an ellipse around its semi-major or semi-minor axis. In the case of the earth, the axis
of rotation can be considered the semi-minor axis that is defined by the line connecting the poles. The earth
is actually best approximated as an oblate spheroid, meaning that it is flattened at the poles, although this geometry does not quite describe its shape exactly either. The geometry of
an ellipsoid is best expressed using spherical coordinates.
For small maps, it is inconvenient and unnecessary to deal with the complex mathematics of
three dimensional curved surfaces, because in this case
we are dealing with small
sections of the earth's surface that appear to us small humans as a plane (thus the existence of
state plane and other essentially 2D coordinate systems.)
Before we talk about how to map a sphere to a plane we need to review some of our forgotten fourth grade geography.
Remember learning about latitude and longitude? Latitude and longitude are
two of the three polar coordinates needed to describe a sphere (or spheroid) precisely (the third being r, the distance of the earth's surface from the center of the earth.), Latitude is the number of
degrees north or south of the equator as measured from a point at the center of
the earth (for geocentric latitude) or from the surface normal of the point of interest to the plane
intersecting the equator (geodetic latitude). (Note: these are the same for a sphere,
but not the same for an ellipsoid.)
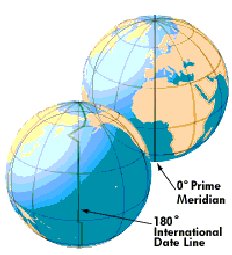
Lines of constant latitude run
around the globe parallel to the equator. Longitude is the number of
degrees east or west of the prime meridian. Latitude runs from 0 to 90
degrees and longitude runs from 0 to 180 degrees. East longitude and north latitude are represented
by positive numbers and south latitude and west longitude are represented by
a negative numbers. The north pole is at 90
degrees north latitude and the south pole is (-)90 degrees south. At the
opposite side of the globe from the prime meridian (at 180 degrees) is the
International Date Line. Latitude and longitude can be expressed in
degrees, minutes and seconds or in decimal fractions. See the first figure
at the right.
The lines of latitude and longitude are often projected onto flat surfaces in
order to describe position on a planar map. Projecting a curved surface
like that of a sphere onto a plane produces distortion. Distortion is never
a matter of "if" but always a matter of "how much and what kind".
There are dozens if not hundreds of different map projections, too many to describe in detail here.
Each one has its advantages and disadvantages. We will focus on a type of
projection that terrain
modelers encounter the most: the Mercator.
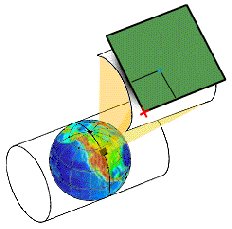
Mercator's projection was created (by Mercator) by essentially wrapping a cylinder around the equator and
then projecting lines of latitude onto the cylinder according to a mathematical
formula (a projection). When the cylinder is unrolled, a flat coordinate system is
produced. A cylinder can be unrolled without creating distortion in the
east-west directions, the distortion being limited to north/south only.
Areas close to the equator exhibit little distortion either way.
The problem is, most of the equator is over the ocean, and areas of interest
tend to be elsewhere. One solution is to place the cylinder on its side as
shown in the second figure above.
This is called a transverse projection, because the cylinder is opposite to the
way it normally goes. Such a cylinder is tangent to a meridian.
Distortion is minimal along the line of tangency, but distortion quickly becomes
hopeless as you travel east or west from the tangent meridian. One
solution is to use not one projection but many such that each cylinder is
rotated slightly along the equator.
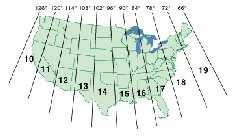
The Universal Transverse Mercator system does just this. The world is divided
into 60 zones of latitude, each 6o wide, that extend from 84o
N to 80o S. These zones begin at 180o longitude and are
numbered consecutively eastward. The continental United States is covered by 10
UTM grid zones. In the northern hemisphere each zone's northing coordinate
begins at the equator as 0,000,000 and are numbered north in meters. The
easting coordinates are measured from an artificial reference line drawn
parallel and 500,000 meters to the west of the zone's central meridian. (Thus
each central meridian is numbered 500,000.) The third figure shows the ten UTM zones
spanning the United States.
Although the UTM system is widely used by the USGS and others it has an inherent
limitation: it is not possible to combine maps across two UTM zones without
creating excessive distortion. This is because each UTM zone describes a
completely different projection (remember the cylinder thing). That is, the maps are each described adequately in their own coordinate systems. It is obviously not possible to use both systems because adjacent UTM zones will each have a point described as 161,000, 3,000,000 for example but they will be different points geographically. One way to rationalize the two projections would be to choose either of the two projections and then reproject the other map onto the chosen UTM projection. For the geometric reasons mentioned earlier however, this would cause the reprojected map to be exceedingly distorted. The correct solution in this case is to choose a
completely different projection that describes the entire area of interest more acceptably, and then reproject both maps onto the common optimal reference surface.
Inconsistent map projections can be a problem in many areas of cartography. Several of the articles on this site describe techniques for overlaying one type of data on top of another for the creation of terrain models. For example, satellite photos may be overlaid on digital elevation models in order to create realistic terrain models. It is important in this case that both the digital elevation model and the overlay image be of the same projection. Even this is not entirely sufficient as there are other distortions that can cause mismatches even if the projections are common. For example, satellite images are often distorted due to non-alignment of the camera's focal plane normal with the earth's surface normal at the point where the camera is aimed. This type of error is corrected using a process called orthorectification, which requires knowledge of elevation data in the area of interest.
There is another critical bit of information that is required before you are
totally confused: the datum. The need for a datum is the consequence of
man's inability to describe mathematically the exact shape of the earth.
It turns out that the earth's shape is a complex thing since the lithosphere
behaves more like a fluid than a solid and assumes a shape that minimizes its
energy as a function of its rotation and the effect of its own gravitational forces and also the lunar gravitational effect. As
a result, geographers use a model (that is always an ellipsoid, but not always the same ellipsoid) that is an approximation of the true shape of
the earth. It is helpful if the "model" coincide with at least one point on the actual surface of the earth,
thereby "anchoring" the model to that point. The widely-used NAD27 datum is anchored at such a point
at Meade's Ranch, Kansas USA. (Actually, this is not completely correct. In the case of geocentric systems, the datum is actually within the earth, at its center. This location can now be determined with sufficient accuracy using satellite measurements.)
The problem is, if the model does not exactly coincide with the true shape of
the earth (and none do), errors multiply and compound the further away one moves from the
datum. Such a model anchored at a datum will assign a certain latitude and
longitude to every point on the earth's surface. So will a different model
anchored to a different datum. The problem is, they will not be the same
values.
For example the recent introduction of the North American Datum of 1983 (NAD83) as
a replacement for the long-established North American Datum of 1927 (NAD27).
NAD83 is based on the GRS80 ellipsoid, derived from satellite geodesy, whereas
NAD27 uses the Clarke 1866 ellipsoid. A point having a given latitude and
longitude in NAD27 may be displaced on the order of many tens of meters from another
point having the identical latitude and longitude in NAD83. So it is
important to define your datum as well as your coordinates. As mentioned, it is possible to convert from one projection
to another projection. This is a complicated mathematical exercise requiring perhaps multiple transformations.
This very brief exposition has just scratched the surface of subject that sometimes gives the professionals pause. For more information,
SeiSoft
offers good information as well as some free software for converting between datums.
|